React - debug app
In this article, we would like to show you how to debug React application.
We should focus on:
- what tools use to debug React code:
- Google Chome DevTool (or other web browser tools),
- VS Code with attached JavaScript engine (Google Chome Browser or NodeJS),
- how make debbuging process easier:
- use React Developer Tools (Google Chrome Browser plugin here),
- use
console.logto print all necessary information, - use
debuggerkeyword inside React code to pause code executing, - build project with
npm run devto get not compressed version of the code. - use some more advanced plugins e.g. reducer plugin.
1. Using React Developer Tools
The best solution is to have a development version, download this official tool, install it, find it in tabs (in your browser) and then you can use the inspector, select items and jump between components.
Note:
Here you can read more about the solution and how to get React Developer Tools.
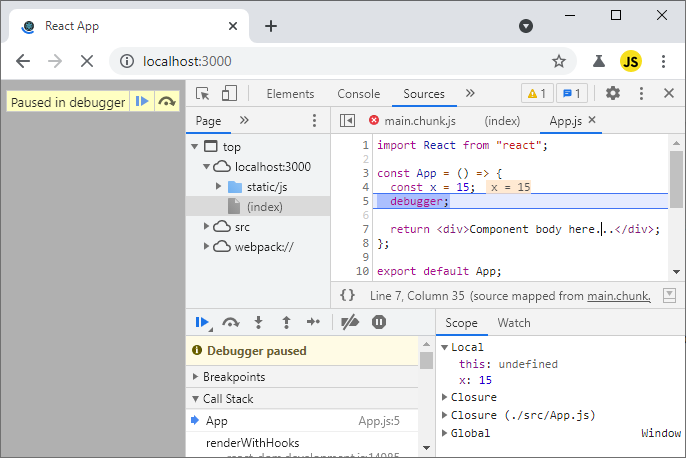
2. Using debugger keyword
This is the same solution as setting a breakpoint in the debugger. The debugger keyword stops the execution of JavaScript and calls the debugging function.
Note:
Before you run the example below open developer tools (F12) in your browser.
Runnable example:
// ONLINE-RUNNER:browser;

// Note: Uncomment import lines during working with JSX Compiler.
// import React from 'react';
// import ReactDOM from 'react-dom';

const App = () => {
  const x = 15;
  debugger;

  return <div>Component body here...</div>;
};

const root = document.querySelector('#root');
ReactDOM.render(<App />, root );
result:
3. Using console.log
You can use console.log() to display JavaScript values in the debugger in your browser. Then you can find them in the console and jump to the code line.
Runnable example:
// ONLINE-RUNNER:browser;

// Note: Uncomment import lines during working with JSX Compiler.
// import React from 'react';
// import ReactDOM from 'react-dom';

const App = () => {
  const x = 15;
  console.log("x = " + x);

  return <div>Component body here...</div>;
};

const root = document.querySelector('#root');
ReactDOM.render(<App />, root );
4. Using npm run dev command
// TODO