DE
JavaScript - Math.log() Methode - Beispiel und Dokumentation
3
points
Die Math.log() Methode gibt den natürlichen Logarithums (Basis e) einer Zahl zurück.
// ONLINE-RUNNER:browser;

// Natürlicher Logarithmus (Logarithmus mit Basis e):
//                     x            y
console.log( Math.log( 1    ) ); // 0
console.log( Math.log( 7    ) ); // 1.9459101490553132
console.log( Math.log( 10   ) ); // 2.3025850929940460
console.log( Math.log( 100  ) ); // 4.6051701859880920
console.log( Math.log( 1000 ) ); // 6.9077552789821370

console.log( Math.log( -1        ) ); //  NaN
console.log( Math.log(  0        ) ); // -Infinity
console.log( Math.log( +Infinity ) ); // +Infinity

console.log( Math.E ); // 2.718281828459045

// Logarithmus mit benutzerdefinierter Basis wird im folgenden Beispiel platziert.
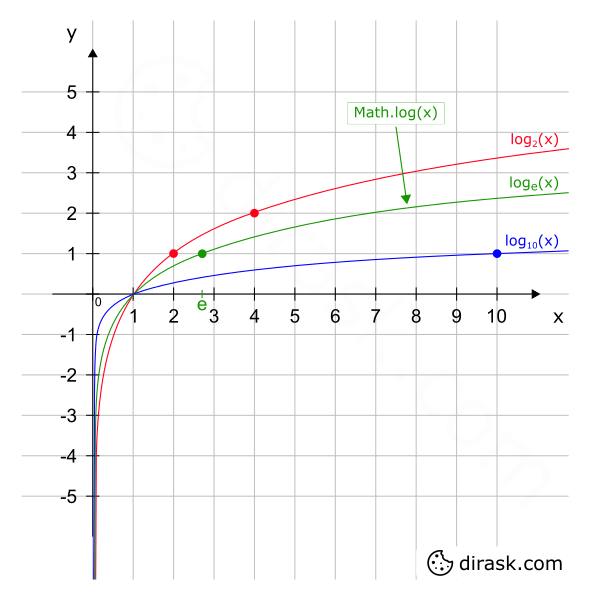
Die Math.log() Methode wird im folgenden Chart dargestellt:
1. Dokumentation
| Syntax | Math.log(x) |
| Parameter | x - eine Ganzzahl oder eine Gleitkommazahl im Bereich von 0 bis +Infinitiv (Grundwerte). |
| Ergebnis |
Wenn Wenn Wenn |
| Beschreibung |
|
2. Logarithmus mit einem nichtstandarisierten Basisbeispiel
Dieses Beispiel zeigt eine logarithmische Funktionsberechnung mit eigener Basis.
// ONLINE-RUNNER:browser;

function calculateLogarithm(base, x) {
	var a = Math.log(x);
    var b = Math.log(base);

    return a / b;
}

// Logarithmus mit nichtstandarisierter Basis:
//                               Basis   x               y
console.log( calculateLogarithm( 2,      2      ) ); //  1
console.log( calculateLogarithm( 2,      4      ) ); //  2
console.log( calculateLogarithm( Math.E, Math.E ) ); //  1
console.log( calculateLogarithm( 3,      9      ) ); // ~2
console.log( calculateLogarithm( 3,      81     ) ); // ~4
console.log( calculateLogarithm( 10,     10     ) ); //  1
3. Zeichnen auf dem Canvas-Element - Beispiel
// ONLINE-RUNNER:browser;

<!doctype html>
<html>
<head>
  <style> #canvas { border: 1px solid black; } </style>
</head>
<body>
  <canvas id="canvas" width="400" height="400"></canvas>
  <script>

    var canvas = document.querySelector('#canvas');
    var context = canvas.getContext('2d');

    // logarithm chart range
    var x1 =  0;
    var x2 = 10;
    var y1 = -5;
    var y2 =  4;

    var dx = 0.005;

    var xRange = x2 - x1;
    var yRange = y2 - y1;

    function calculateLogarithm(base, x) {
        var a = Math.log(x);
        var b = Math.log(base);

        return a / b;
    }

    function calculatePoint(base, x) {
        var y = calculateLogarithm(base, x);

        // Das Chart wird aufgrund der invertierten Pixel der Leinwand horizontal gespiegelt

        var nx = (x - x1) / xRange;       // normalized x
        var ny = 1.0 - (y - y1) / yRange; // normalized y

        var point = {
            x: nx * canvas.width,
            y: ny * canvas.height
        };

        return point;
    }

    function drawChart(base, color, thickness) {
        var point = calculatePoint(base, x1);

        context.beginPath();
        context.lineWidth = thickness;
      	context.strokeStyle = color;
        context.moveTo(point.x, point.y);

        for (var x = x1 + dx; x < x2; x += dx) {
            point = calculatePoint(base, x);
            context.lineTo(point.x, point.y);
        }

        point = calculatePoint(base, x2);
        context.lineTo(point.x, point.y);
        context.stroke();
    }

    console.log('log_2(x)  <- red');
    console.log('log_e(x)  <- green');
    console.log('log_10(x) <- blue');

    //           base     color   thickness
    drawChart(      2, '#ff001b',       0.8 ); // red
    drawChart( Math.E, '#159600',       2   ); // green
    drawChart(     10, '#0000ff',       0.8 ); // blue

    console.log('x range: <' + x1 + '; ' + x2 + '>');
    console.log('y range: <' + y1 + '; ' + y2 + '>');

  </script>
</body>
</html>