EN
JavaScript - draw integral on canvas element
4
points
In this short article, we would like to show a simple way how to draw integral function on HTML5 canvas element using JavaScript.
To draw function and integral function we should use the following formula for calculations:
// ONLINE-RUNNER:browser;

const dx = 0.2;  // x value step - used only for calculations precision
                 // if dx is very small then calculations are more precised

const x2Function = x => x * x;

// Integral will be calculated on <x1, x2> range.

const x1 = -2;
const x2 = +2;

const zeroValue = (x1 < 0 && x2 > 0 ? dx * x2Function(0) : 0);

let negativeSum = 0;
let positiveSum = 0;

const calculateX2NegativeIntegral = x => (negativeSum -= dx * x2Function(x));
const calculateX2PositiveIntegral = x => (positiveSum += dx * x2Function(x));

console.log(`Negative part:`);

for (let x = 0; x > x1; x -= dx) { // it is very important to iterate from 0 to x1
    console.log(`(${x}, ${calculateX2NegativeIntegral(x)})`);
}

console.log(`Positive part:`);

for (let x = 0; x < x2; x += dx) { // it is very important to iterate from 0 to x2
    console.log(`(${x}, ${calculateX2PositiveIntegral(x)})`);
}
Practical example:
// ONLINE-RUNNER:browser;
<!doctype html>
<html>
<head>
<style> canvas { border: 1px solid silver; } </style>
</head>
<body>
<pre>
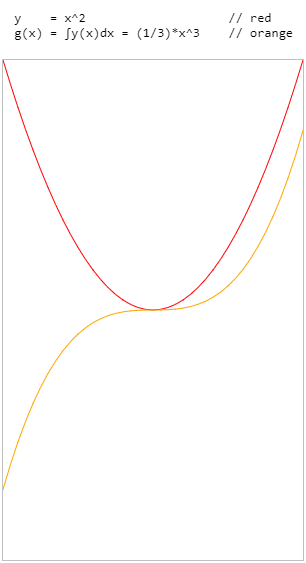
y = x^2 // red
g(x) = ∫y(x)dx = (1/3)*x^3 // orange
</pre>
<canvas id="canvas" width="300" height="500"></canvas>
<script>
function iterateNegative(x1, x2, dx, callback) {
for (var x = x1 + dx; x > x2; x += dx) {
callback(x);
}
return x1 > x2;
}
function iteratePositive(x1, x2, dx, callback) {
for (var x = x1 + dx; x < x2; x += dx) {
callback(x);
}
return x1 < x2;
}
function Calculator(canvas, x1, x2, y1, y2, func) {
var cWidth = canvas.width;
var cHeight = canvas.height;
var xRange = x2 - x1;
var yRange = y2 - y1;
this.calculatePoint = function(x) {
var y = func(x);
// chart will be reversed horizontaly because of reversed canvas pixels
var nx = (x - x1) / xRange; // normalized x
var ny = 1.0 - (y - y1) / yRange; // normalized y
return {
x: nx * cWidth,
y: ny * cHeight
};
};
}
function Chart(canvas, calculator, iterate) {
var context = canvas.getContext('2d');
var callback = function(x) {
var point = calculator.calculatePoint(x);
context.lineTo(point.x, point.y);
};
this.drawChart = function(color, width, x1, x2, dx) {
var a = calculator.calculatePoint(x1);
context.beginPath();
context.moveTo(a.x, a.y);
if (iterate(x1, x2, dx, callback)) {
var b = calculator.calculatePoint(x2);
context.lineTo(b.x, b.y);
}
context.strokeStyle = color || 'black';
context.lineWidth = width || 1;
context.stroke();
};
};
function FunctionChart(canvas, x1, x2, y1, y2, dx, func) {
var calculator = new Calculator(canvas, x1, x2, y1, y2, func);
var chart = new Chart(canvas, calculator, iteratePositive);
this.drawChart = function(color, width) {
chart.drawChart(color, width, x1, x2, dx);
};
}
function IntegralChart(canvas, x1, x2, y1, y2, dx, c, func) {
var zeroValue = (x1 < 0 && x2 > 0 ? dx * func(0) : 0);
var negativeSum = zeroValue + c;
var positiveSum = zeroValue + c;
var negativeIntegral = function(x) {
if (x < 0) {
negativeSum -= dx * func(x);
}
return negativeSum;
};
var positiveIntegral = function(x) {
if (x > 0) {
positiveSum += dx * func(x);
}
return positiveSum;
};
var negativeCalculator = new Calculator(canvas, x1, x2, y1, y2, negativeIntegral);
var positiveCalculator = new Calculator(canvas, x1, x2, y1, y2, positiveIntegral);
var negativeChart = new Chart(canvas, negativeCalculator, iterateNegative);
var positiveChart = new Chart(canvas, positiveCalculator, iteratePositive);
this.drawChart = function(color, width) {
negativeSum = zeroValue + c;
positiveSum = zeroValue + c;
negativeChart.drawChart(color, width, 0, x1, -dx);
positiveChart.drawChart(color, width, 0, x2, +dx);
};
};
// Usage example:
var canvas = document.querySelector('#canvas');
var dx = 0.1; // x value step used to calculate derivate
var c = 0.0; // constant (y shift of integral function)
var x2Function = function(x) {
return x * x;
};
var functionChart = new FunctionChart(canvas, -2, +2, -4, 4, dx, x2Function);
var integralChart = new IntegralChart(canvas, -2, +2, -4, 4, dx, c, x2Function);
functionChart.drawChart('red', 1);
integralChart.drawChart('orange', 1);
</script>
</body>
</html>