EN
JavaScript - draw derivative on canvas element
9
points
In this short article, we would like to show a simple way how to draw derivative function on HTML5 canvas element using JavaScript.
To draw function and derivate function we should use the following formula for calculations:
var dx = 0.1;  // x value step - used only for calculations precision
               // if dx is very small then calculations are more precised

var x2Function = function(x) {
    return x * x;
};

// Dervitive function from definition:
//     lim (dx->0) (f(x + dx) - f(x)) / dx    or:    lim (h->0) (f(x + h) - f(x)) / h
//
//     https://en.wikipedia.org/wiki/Derivative#Definition
//
var x2Derivative = function(x) {
    var dy = x2Function(x + dx) - x2Function(x);
    return dy / dx;
};
Practical example:
// ONLINE-RUNNER:browser;
<!doctype html>
<html>
<head>
<style> canvas { border: 1px solid silver; } </style>
</head>
<body>
<pre>
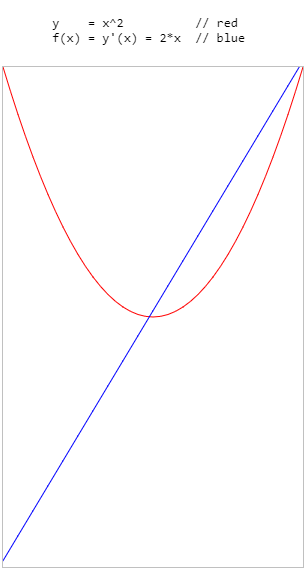
y = x^2 // red
f(x) = y'(x) = 2*x // blue
</pre>
<canvas id="canvas" width="300" height="500"></canvas>
<script>
function Calculator(canvas, x1, x2, y1, y2, func) {
var cWidth = canvas.width;
var cHeight = canvas.height;
var xRange = x2 - x1;
var yRange = y2 - y1;
this.calculatePoint = function(x) {
var y = func(x);
// chart will be reversed horizontaly because of reversed canvas pixels
var nx = (x - x1) / xRange; // normalized x
var ny = 1.0 - (y - y1) / yRange; // normalized y
return {
x: nx * cWidth,
y: ny * cHeight
};
};
}
function FunctionChart(canvas, x1, x2, y1, y2, dx, func) {
var context = canvas.getContext('2d');
var calculator = new Calculator(canvas, x1, x2, y1, y2, func);
this.drawChart = function(color, width) {
var a = calculator.calculatePoint(x1);
var b = calculator.calculatePoint(x2);
context.beginPath();
context.moveTo(a.x, a.y);
for (var x = x1 + dx; x < x2; x += dx) {
var point = calculator.calculatePoint(x);
context.lineTo(point.x, point.y);
}
context.lineTo(b.x, b.y);
context.strokeStyle = color || 'black';
context.lineWidth = width || 1;
context.stroke();
};
}
function DerivativeChart(canvas, x1, x2, y1, y2, dx, func) {
var derivative = function(x) {
var dy = func(x + dx) - func(x);
return dy / dx;
};
var chart = new FunctionChart(canvas, x1, x2, y1, y2, dx, derivative);
this.drawChart = function(color, width) {
chart.drawChart(color, width);
};
}
// Usage example:
var canvas = document.querySelector('#canvas');
var dx = 0.1; // x value step used to calculate integral
var x2Function = function(x) {
return x * x;
};
var functionChart = new FunctionChart(canvas, -2, +2, -4, 4, dx, x2Function);
var derivativeChart = new DerivativeChart(canvas, -2, +2, -4, 4, dx, x2Function);
functionChart.drawChart('red', 1);
derivativeChart.drawChart('blue', 1);
</script>
</body>
</html>