Stop infinite loop in JavaScript debugger - Google Chrome
Have you ever written an infinite loop that freezes an entire page in your browser?
In this article, I will try to show you how to deal with such a problem.
Using Google Chrome, there are few ways to stop JavaScript debugging:
- stop button in Chrome DevTools,
- end process by closing tab or window,
- end process button in Task manager.
1. Stop button in Chrome DevTools example ⏯🛑
📝 Note:
To use this approach DevTools should be turned on before JavaScript code will be executed. Otherwise we won't be able to open the tools with F12 because Chrome window will freeze. You will still be able to turn on the tools with browser menu, but the tools won't connect to the executing source code to stop it - in this case, code execution can only be stopped by closing a tab or window. Sometimes, with a low amount of RAM or a large amount of open tabs, DevTools may have trouble with stopping the infinity loop.
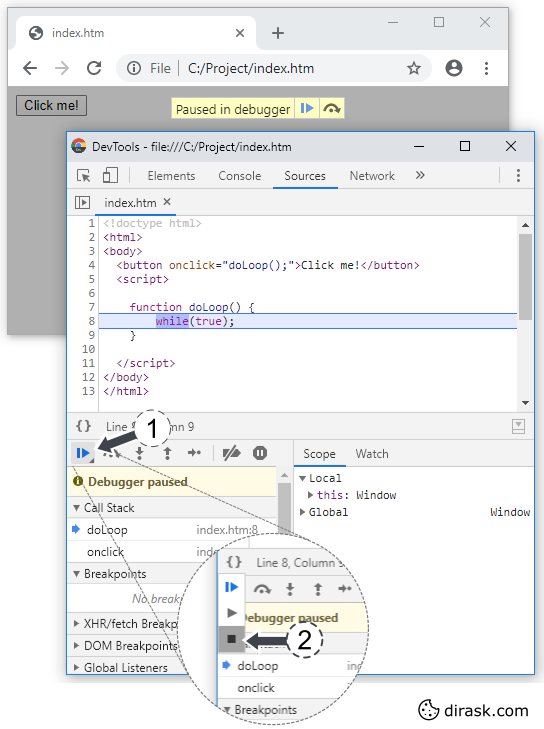
There are several steps you need to take to get this done:
- open Chrome DevTools with F12, Ctrl+Shift+i or from menu Main menu→More tools→Developer tools,
- open web page that you want to debug,
- run some code that has infinity loop,
- click Chrome DevTools window to get focus on it,
- pause script with F8, Ctrl+\ or by clicking Pause script execution button,
- press mouse button for 1-3 seconds on the button again to see more options,
- move click action to square stop button on expanded menu to stop permanently script execution.

2. End process by closing tab or window example
Use close button to stop the process. If it does not help use Task manager described in next solution.
3. End process button in Task manager example
In this solution you need to:
- open Chrome Task manager with Shift+Esc or from menu Main menu→More tools→Task manager,
- find the process on list by tab name or biggest CPU load (use column sort option),
- select process and click End process button.