Create simple animated bar chart in React
Did you know you don't need much to build an animated bar chart?
In this article, I will try to explain how to get such an effect with React. 📊
Final effect of the post:
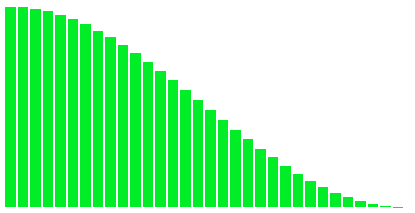
The main idea is to create individual bars that are described from 0 to 100%. The bars are arranged sequentially next to each other in a chart, using an example data set
based on the cosine function.
Each change of the dataset describing the chart causes a smooth re-rendering (this happens due to a simple style called transition).
The whole effect is achieved with a few lines, most of the effect is actually styles. 🎨
Practical example:
// ONLINE-RUNNER:browser;

// import React from 'react';
// import ReactDOM from 'react-dom';

// ---------------------------------

const containerStyle = {
  	padding: '0 1px',
  	background: '#ffffff',
  	flex: '1'
};

const spaceStyle = {
  	background: '#ffffff',
  	transition: '0.3s'
};

const barStyle = {
  	background: '#00cc00',
  	transition: '0.3s'
};

const Bar = ({value}) => {
  	return (
      <div style={containerStyle}>
        <div style={{...spaceStyle, height: `${100 - value}%`}} />
        <div style={{...barStyle, height: `${value}%`}} />
      </div>
    );
};

const chartStyle = {
  	width: '400px',
  	height: '300px',
	display: 'flex',
  	overflow: 'hidden'
};

const Chart = ({data}) => {
	return (
      <div style={chartStyle}>
        {data.map((value, index) => <Bar key={index} value={value} />)}
      </div>
    );
};

// ---------------------------------

const calculateData = (xOffset) => {
	const data = [ ];
    for (var x = 0; x < 3.1415; x += 0.1) {
        const y = Math.cos(x + xOffset) + 1;
        data.push(50 * y);
    }
  	return data;
};

const App = () => {
    const [data, setData] = React.useState(() => calculateData(0));
  	const xOffsets = [0, 0.7853, 1.5707, 2.3559, 3.1415];
    return (
      <div>
        <Chart data={data} />
        <br />
        <div>
          <span>xOffset: </span>
          {xOffsets.map(xOffset => {
              const handleClick = () => setData(calculateData(xOffset));
              return (
                <button key={xOffset} onClick={handleClick}>{xOffset}</button>
              );
          })}
        </div>
      </div>
    );
};

const root = document.querySelector('#root');
ReactDOM.render(<App />, root);
What do you think about such a chart? Do you think it would be possible to construct a simple library for different types of charts?
Let me know in the comments! 😊