EN
JavaScript - draw Rastrigin 2D on canvas element
13
points
In this short article, we would like to show a simple way how to plot a Rastrigin 2D chart on HTML5 canvas element using JavaScript.
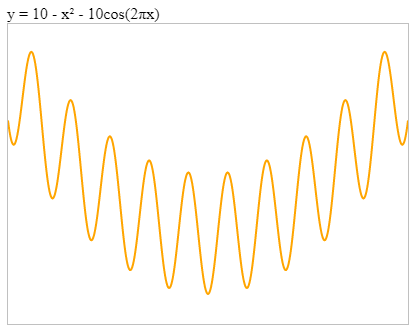
Used formula:
// ONLINE-RUNNER:browser;

const rastrigin2D = function(x) {
    return 10 + x * x - 10 * Math.cos(2 * Math.PI * x);
};


// Usage example:

console.log(rastrigin2D(-5.12));  // 28.924713725785892
console.log(rastrigin2D(-2.56));  // 25.851364858882512
console.log(rastrigin2D(0.0));    // 0
console.log(rastrigin2D(+2.56));  // 25.851364858882512
console.log(rastrigin2D(+5.12));  // 28.924713725785892
Practical example
// ONLINE-RUNNER:browser;

<!doctype html>
<html>
<head>
  <style> canvas { border: 1px solid silver; } </style>
</head>
<body>
  <div>y = 10 - x² - 10cos(2πx)</div>
  <canvas id="canvas" width="400" height="300"></canvas>
  <script>

    function Calculator(canvas, x1, x2, y1, y2, func) {
      	var cWidth = canvas.width;
      	var cHeight = canvas.height;
      	var xRange = x2 - x1;
      	var yRange = y2 - y1;
        this.calculatePoint = function(x) {
            var y = func(x);
            // chart will be reversed horizontaly because of reversed canvas pixels
            var nx =       (x - x1) / xRange;  // normalized x
            var ny = 1.0 - (y - y1) / yRange;  // normalized y
            return {
                x: nx * cWidth,
                y: ny * cHeight
            };
        };
    }

    function Chart(canvas, x1, x2, y1, y2, dx, func) {
      	var context = canvas.getContext('2d');
      	var calculator = new Calculator(canvas, x1, x2, y1, y2, func);
      	this.drawChart = function(color, width) {
            var a = calculator.calculatePoint(x1);
            var b = calculator.calculatePoint(x2);
        	context.beginPath();
            context.moveTo(a.x, a.y);
            for (var x = x1 + dx; x < x2; x += dx) {
                var point = calculator.calculatePoint(x);
                context.lineTo(point.x, point.y);
            }
            context.lineTo(b.x, b.y);
          	context.strokeStyle = color || 'black';
          	context.lineWidth = width || 1;
            context.stroke();
        };
    }


    // Usage example:

    var canvas = document.querySelector('#canvas');

    var rastrigin2D = function(x) {
    	return 10 + x * x - 10 * Math.cos(2 * Math.PI * x);
    };

    //                             min    max    min    max  (x step)
    //                              x      x      y      y     dx
    var chart = new Chart(canvas, -5.12, +5.12, -5.0, +45.0, +0.02, rastrigin2D);

    chart.drawChart('orange', 2);

  </script>
</body>
</html>