EN
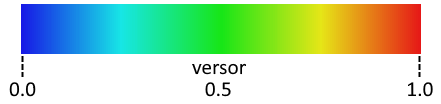
JavaScript - HSV distribution model (heatmap color model)
5
points
In this short article, we would like to show how in JavaScript, create HSV distribution model.
e.g. that can be used to color 3D chart values.
Note: to know how HSV color space looks, go to this article.
Practical example:
// ONLINE-RUNNER:browser;

const keepRange = (min, max, value) => {
    if (value < min) {
        return min;
    }
    if (value > max) {
        return max;
    }
    return value;
};

// Converts HSV color to RGB.
// Arguments:
//   hsv           HSV color
//     hue         from 0 to 360 degree
//     saturation  from 0 to 1
//     value       from 0 to 1
// Returns: RGB color (components from 0 to 1)
//
const toRgb$1 = (hsv) => {
    let d = 0.0166666666666666 * hsv.hue;
	let c = hsv.value * hsv.saturation;
	let x = c - c * Math.abs(d % 2.0 - 1.0);
	let m = hsv.value - c;
	c += m;
	x += m;
    switch (d >>> 0) {
        case 0: return {red: c, green: x, blue: m};
        case 1: return {red: x, green: c, blue: m};
        case 2: return {red: m, green: c, blue: x};
        case 3: return {red: m, green: x, blue: c};
        case 4: return {red: x, green: m, blue: c};
    }
    return {red: c, green: m, blue: x};
};

// Converts HSV color to RGB.
// Arguments:
//   hsv           HSV color
//     hue         from 0 to 360 degree
//     saturation  from 0 to 1
//     value       from 0 to 1
// Returns: RGB color (components from 0 to 255)
//
const toRgb$2 = (hsv) => {
    var rgb = toRgb$1(hsv);
    return {
        red: Math.round(255 * rgb.red),
        green: Math.round(255 * rgb.green),
        blue: Math.round(255 * rgb.blue)
    };
};

// Creates HSV based model that provides smooth transition using hue component.
// Arguments:
//   startHue, stopHue  indicates hue component model range (from 0 to 360 degree)
//   saturation         indicates saturation component model constant (from 0 to 1)
//   value              indicates value component model constant (from 0 to 1)
//   resolution         indicates smooth transition quantization
// Result: retuns function that returns calculated RGB color for indicated index (from 0 to 1)
//
const createHsvDistribution = (startHue, stopHue, saturation, value, resolution) => {
    const range = stopHue - startHue;
    const step = range / resolution;
    const colors = Array(resolution + 1);
    for (let i = 0, hue = startHue; i < colors.length; i += 1, hue += step) {
        const hsv = {hue, saturation, value};
        colors[i] = toRgb$2(hsv);
    }
    return (versor) => {
        const value = Math.round(versor * resolution);
        const index = keepRange(0, colors.length - 1, value);
        return colors[index];
    };
};


// Helpers:

const drawPixel = (data, width, x, y, rgb) => {
    const roundedX = Math.round(x);
    const roundedY = Math.round(y);
    const index = 4 * (width * roundedY + roundedX);
    data[index + 0] = rgb.red;
    data[index + 1] = rgb.green;
    data[index + 2] = rgb.blue;
    data[index + 3] = 255;
};

const drawDistribution = (canvas, distribution) => {
    const context = canvas.getContext('2d');
    const image = context.createImageData(canvas.width, canvas.height);
    for (let y = 0; y < canvas.height; ++y) {
        for (let x = 0; x < canvas.width; ++x) {
            const versor = 1.0 - y / canvas.height;         // scales y value to versor value (from 0 to 1)
            const color = distribution.call(null, versor);  // returns pixel color
            drawPixel(image.data, canvas.width, x, y, color);
        }
    }
    context.putImageData(image, 0, 0);
};


// Usage example:

const distribution = createHsvDistribution(240, 0.0, 0.9, 0.9, 200);

// To get pixel color just use:
//
//    const versor = 0.0;                             // versor should be from 0.0 to 1.0
//    const color = distribution.call(null, versor);  // color has RGB format

const canvas = document.createElement('canvas');

canvas.width = 50;
canvas.height = 400;

drawDistribution(canvas, distribution);

document.body.appendChild(canvas);